
Sports
Baltimore Orioles vs. San Francisco Giants: Head-to-Head Stats
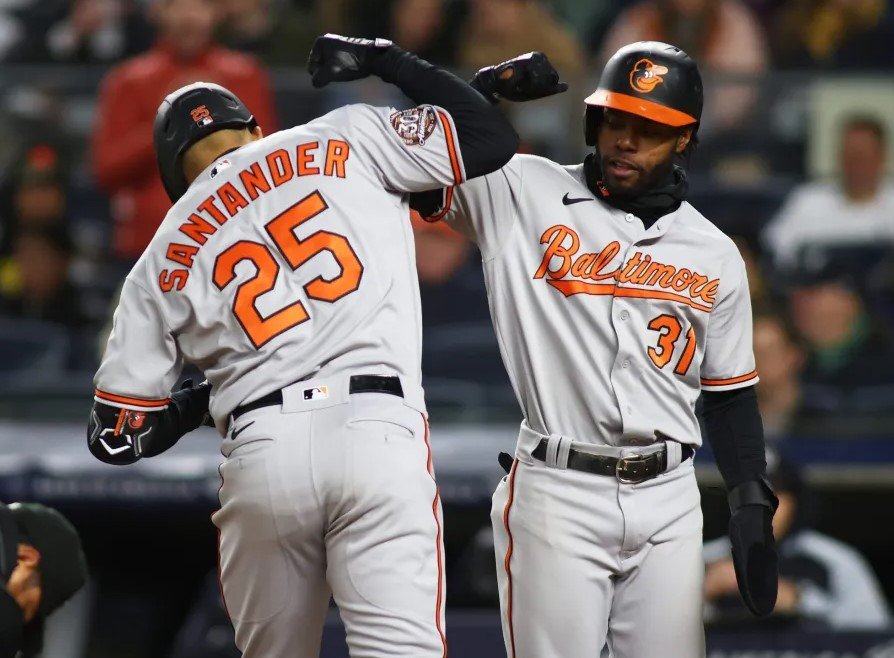
The Baltimore Orioles and the San Francisco Giants have built an intriguing interleague rivalry, with their head-to-head matchups producing an evenly balanced record. Since their first meeting in 2002, both teams have secured 12 victories each across 24 encounters, making it one of the most competitive interleague series in Major League Baseball.
Recent Head-To-Head Results
| Date | Baltimore Orioles (BAL) Runs | San Francisco Giants (SFG) Runs | Venue |
| 2024-09-19 | 5 | 3 | Oriole Park at Camden Yards |
| 2024-09-18 | 3 | 5 | Oriole Park at Camden Yards |
| 2024-09-17 | 0 | 10 | Oriole Park at Camden Yards |
| 2023-06-04 | 8 | 3 | Oracle Park |
| 2023-06-03 | 0 | 4 | Oracle Park |
| 2023-06-02 | 3 | 2 | Oracle Park |
In their most recent series in September 2024, the Giants came out on top, winning two out of three games at Oriole Park at Camden Yards. The series opened on September 17 with an emphatic 10-0 Giants victory, marking the largest winning margin in their head-to-head history. However, Baltimore responded in the final game of the series on September 19, securing a 5-3 win to avoid a sweep.
Yearly Head-To-Head Records
| Season | Orioles Wins | Giants Wins | Orioles Runs Scored | Giants Runs Scored |
| 2002 | 2 | 1 | 10 | 7 |
| 2004 | 1 | 2 | 14 | 20 |
| 2010 | 1 | 2 | 9 | 17 |
| 2013 | 2 | 1 | 17 | 7 |
| 2016 | 2 | 1 | 15 | 15 |
| 2019 | 1 | 2 | 12 | 22 |
| 2023 | 2 | 1 | 11 | 9 |
| 2024 | 1 | 2 | 8 | 18 |
A look at their past meetings reveals a history of hard-fought battles. In their previous three-game series in June 2023 at Oracle Park, the Orioles took two of three games, including an 8-3 victory on June 4. However, the Giants managed a 4-0 shutout in the second game. Similarly, in 2019, San Francisco dominated, winning two out of three games in Baltimore, including an 8-1 victory on June 2.
Overall Head-To-Head Statistics
| Team | Total Wins | Total Runs Scored | Batting Average | On-Base Percentage | Slugging Percentage |
| Baltimore Orioles | 12 | 96 | .241 | .304 | .394 |
| San Francisco Giants | 12 | 115 | .244 | .326 | .405 |
Statistically, the Giants have outscored the Orioles 115-96 over the years, demonstrating a slight offensive edge. The teams’ batting averages are comparable, with the Giants posting a .244 average and the Orioles at .241. However, San Francisco holds a slight advantage in slugging percentage (.405) and on-base percentage (.326), compared to Baltimore’s .394 and .304, respectively.
Largest Victory Margins
| Date | Winning Team | Losing Team | Score | Venue |
| 2024-09-17 | San Francisco Giants | Baltimore Orioles | 10-0 | Oriole Park at Camden Yards |
| 2013-08-11 | Baltimore Orioles | San Francisco Giants | 10-2 | Oracle Park |
The Orioles’ largest victory over the Giants came on August 11, 2013, when they triumphed 10-2 at Oracle Park. Despite the limited number of meetings, the matchups have consistently delivered excitement and unpredictability, making this an underrated yet compelling interleague rivalry.
As both teams continue to evolve, future matchups will be crucial in tipping the balance in favor of one side. For now, the Orioles and Giants remain deadlocked in a battle that spans more than two decades, proving that baseball’s unpredictability is what makes the sport so exhilarating.


How Data and Design Are Quietly Reinventing Short-Term Rental?

Email Extractor Lite 1.4 Review: Features, Benefits, and Alternatives

Joel Greenblatt House and Real Estate Portfolio in 2026

Women’s Phone Cases That Make Perfect Gifts

McLaren 765LT Spider: Specs, Price, Performance, and Features
-

 Health2 months ago
Fish Oil Pills Benefits for Brain Function and Mental Focus
-

 Home Improvement2 months ago
Why Your AC Runs All Day but Your House Still Feels Hot
-

 Health2 months ago
Omega-3 Supplements for Healthy Blood Pressure Support
-

 Digital Marketing2 months ago
Complete Guide to Using Uitly for Link Management